Profile Android Application Starting
Apr 19, 2016 10:54 · 2018 words · 10 minutes read
In Android, there is three types of starts: First Starts, Cold Starts, and Warm Starts.
First start, the slowest, happens the first time the application launches after installation. The app needs to set everything up. It can be a database, configuration files, load the first batch of data, etc… It’s often very slow but only occurring once. You can hide this load time under an onboarding by example.
Warm starts, the fastest, happens when you switch of application and go back without the system freeing it from the memory. Everything is up and running so Android doesn’t have to reload a lot of things. It’s usually very fast and often doesn’t need improvements (or you are creating a game).
Cold start, to finish, happens when your app is not in device’s memory and that Android launches it. An Android device is always managing memory. When your app is not in the foreground and does nothing, Android will clear it and give this freed memory to another process in need. It happens very frequently.
When a user is launching your app, he has to wait during initialization. The more he will wait on this step, the more he will feel it, giving him a sense of slugginess. Even if it’s fast after. You can find a study here in this 2012’s report. Time to launch is the first impression the user will have so we need to impress them.
Cold start, Why it’s so slow
In everyday work, we use libraries to develop and achieve business requirements faster. Those focus on adding features instead of keeping an application quick and responsive. If it’s hardly quantifiable or not adding direct business value, it will rarely be on our development plates.
A big part of used libraries are needed in the whole application, and often initialized in the Application.onCreate(). If we do it without any threading or lazy loading, the onCreate will take more time to process. The longest it takes, the longest the first page will take to be fully displayed. The reason for this is that the Application.onCreate() is the first method launched on every start and no Activity is started until this method is completed.
When the application is slow to start, it displays the Zygote longer, and will break immersion. This root white start screen is not pretty by default.
Today, instead of focusing on creating a beautiful app startup screen with the windowBackground, we will profile this cold start and work on reducing it.
Profiling
Working for Yellow Pages Canada, I will profile our apps, dig in and provide some insight and solutions that can be used. As of today, the problems have been solved but that can still give some ideas on how to fix.
What tools
Usually, I use TraceView and DmTraceDump to find the bottlenecks in the code and fix it. Here we will play with NimbleDroid, a new player in town. They use the same tools but display the results in a very easy to understand way. All performance tests are realized in the same conditions letting you compare with other applications. One of the nice tricks is that you can automatically hook your builds to it and therefore, keeping track of your cold start time, versions after versions. If your code is obfuscated, it’s possible to provide the ProGuard Mapping to reveal problematic methods.
On a side note, a colleague shared me Show Java app that can be useful to see unobfuscated code apps.
Tracing
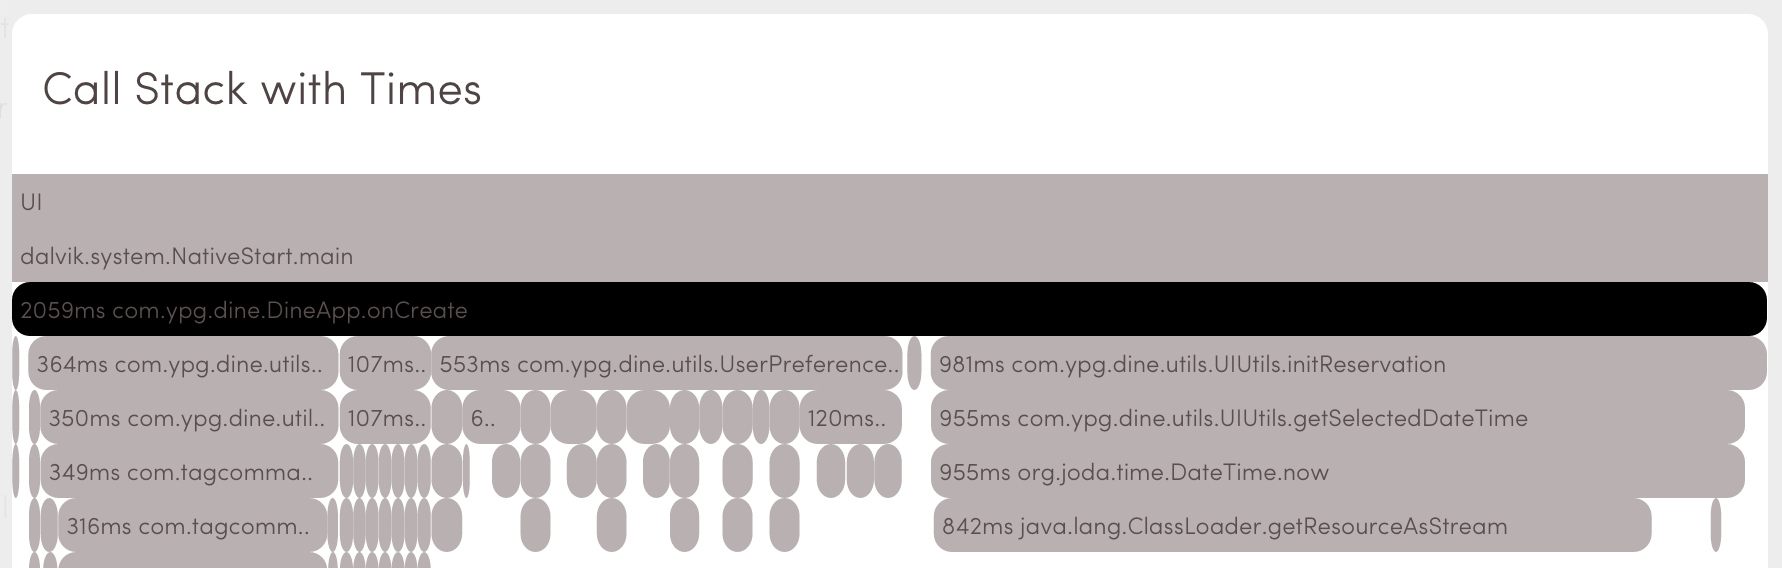
Yp Dine was not a bad player with 2400 ms to start, and with some tweaks, the team was able to have a start time below 1400ms. But, on this old build, we can see below that the DineApp.onCreate() was blocking the process for 2059 ms. Roughly 80% of his start time is blocked here, clicking on this line will open a new view with more details in it.
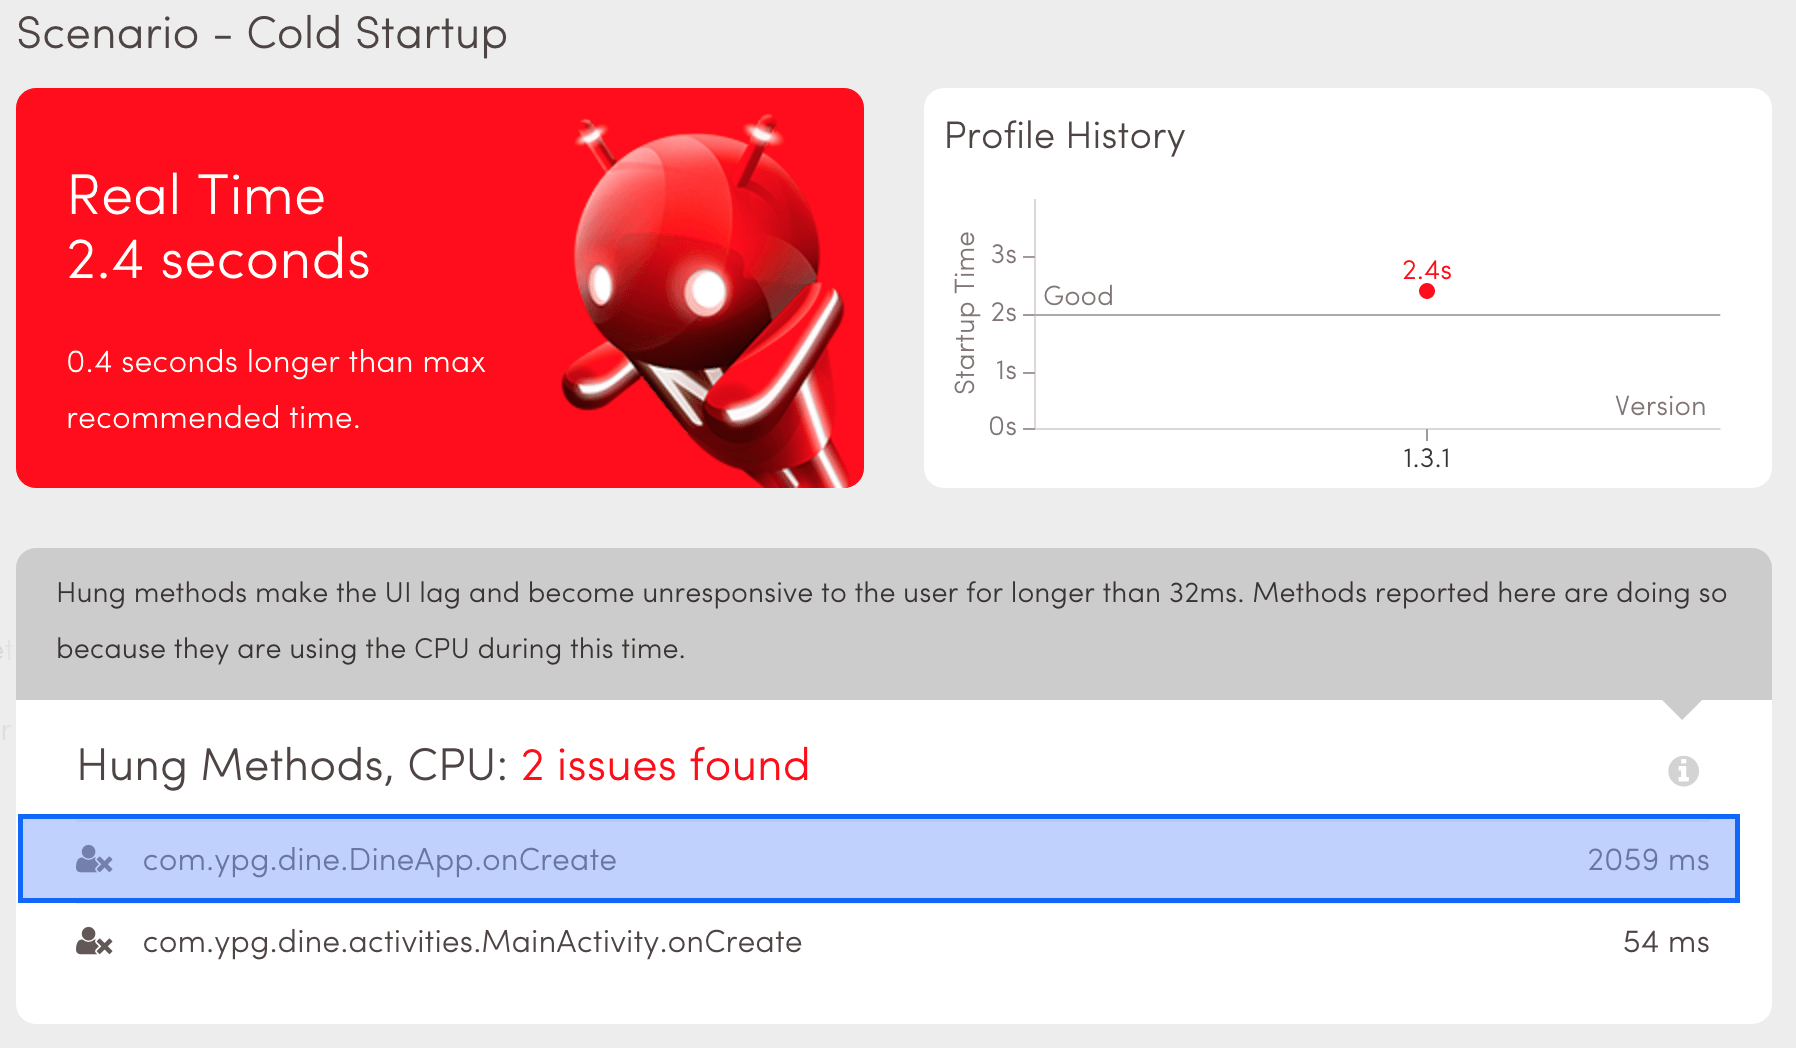
On the call stack, we can see that three methods are taking most of the starting time:
- UIUtils.initReservation (JodaTime), 981ms
- UserPreferences, 553ms
- YpDine.Utils…, 364ms If we can fix this, it will be a good improvement.
If those methods are blocking the UI, it means that they run in the main thread, and if we can instantiate them asynchronously, most of the work will be done.
Always keep in mind to work on the most important issues first, frames dropping on a ListView can be more frustrating that the start time. I like this post from coding horror on Gold Plating, you should take a look if you don’t know it.
That was a quick heads-up on how to find the blocking culprits. Let’s see if we can do something.
Let’s go deeper
Application onCreate
As seen previously, those are the three methods that are blocking the startup:
- AnalyticCommander
- UserPreferences
- initReservation
@Override public void onCreate() {
  DineApp.appContext = getApplicationContext();
  super.onCreate();
  [...]
  final Map<Class, Object> registry = new HashMap<>();
  registry.put(AnalyticCommander.class, new AnalyticCommander(appContext)); // this one is blocking
  ServiceRegistry.create(registry);

  UserPreferences.init(this); // this one too
  [...]
  UIUtils.initReservation(this); // and finally this one
}
As expected, everything is on the onCreate without any threading. I have removed nonrelevant code to focus on the main ones.
Let`s study the different blockers one by one.
Analytic Commander
What’s that
It’s an analytic tool that helps to merge all analytics libraries in a single access point. As all analytic tools, its used everywhere in the application. It's created once in theApplication` initialization and kept in memory in the ServiceRegistry (a Class/Instance map singleton).
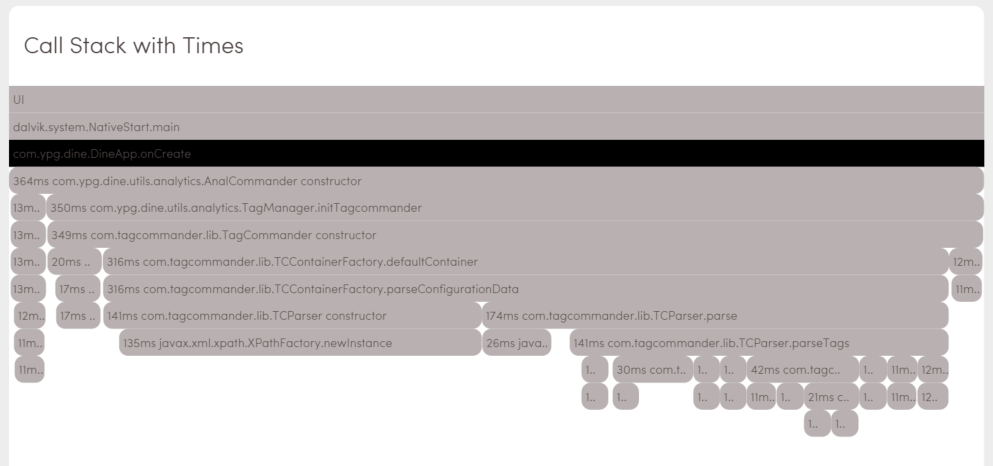
As you can see here, initialization is taking most of his time in TagCommander constructor and Tag parsings. If we put it in a background thread to set it up, we will summon our enemy NullPointerException trying to access the object without having initialized it.
Fire and Forget
Here, we only have to send analytics data. No callback, no UI to update, that’s the perfect candidate for a fire and forget thread. In this case, we can use a Lazy Loading library like in Dagger or [a Lazy Loading class] I wrote some time ago as a ‘quick’ fix.
First, you need to change the existing ServiceRegistry for the Lazy Loading class provided above, create a method to access it from anywhere (static method?) and finally using the initializer interface for AnalCommander object:
registry.addLazy(AnalCommander.class, new LazyServiceRegistry.LazySetter<AnalCommander>() {
    @Override
    public AnalCommander get() {
        return new AnalCommander(appContext);
    }
});
Then, in a background thread, ask the instance and send the call.
new Thread(new Runnable() {
    @Override
    public void run() {
        DineApp.getLazyRegistry().getInstance(AnalComander.class).sendPageView();
    }
}).start();
The Lazy Loading class will initialize and store it locally for later use. We don’t need to wait for the response (Retry on Error should be part of the method called). Now initialization and API call is async and not tied anymore in UIThread.
UserPreferences
What’s going on
UserPreferences.init(this) loads all user data from JSON files stored in SharedPreferences, keeping it in memory during the whole application lifecycle for Search History, User favorites, etc…
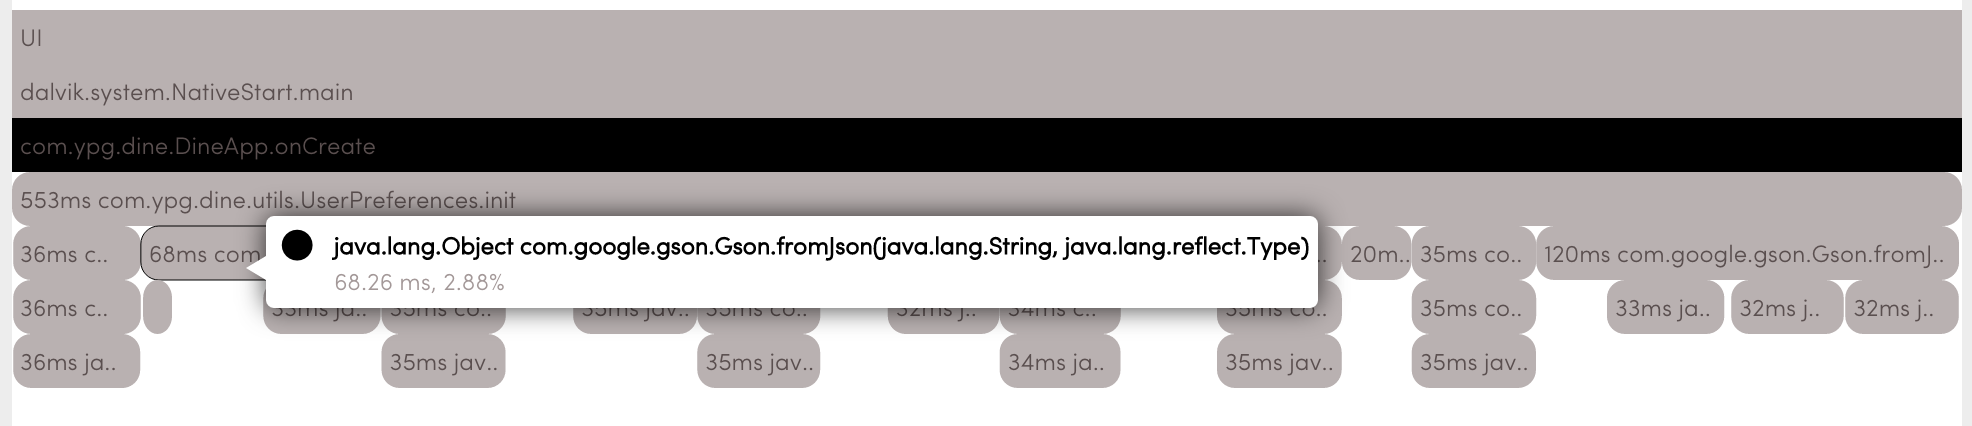
String jsonFavPlaces = sp.getString(KEY_PREFS_FAVORITE_PLACES, "[]");
favPlaces = gson.fromJson(jsonFavPlaces, new TypeToken<HashMap<String, DineMerchantPreference>>() {
    }.getType());
During initialization, it relies heavily on GSON’s reflection causing multiple heavy processing that blocks the main thread. The New York Times have written an excellent post on Improving their Startup Time where they go through the same problems. They solve it by using gson with custom type adapters.
Don’t put all eggs is the same basket
UserPreferences is maybe the most trickier of all. We need his data to be displayed in the first Activity. Unfortunately, this class have multiple problems; it’s a full static class grouping very different data. So even if we need a little portion of it, it needs to be initialized completely. So we will begin by splitting everything under the same package.
- UserPreferences/
LastCities.class - UserPreferences/
FavoritePlaces.class - UserPreferences/
FavoriteCurators.class - UserPreferences/
FavoritePlaylists.class - UserPreferences/
SearchHistory.class - UserPreferences/
RecentMerchant.class - UserPreferences/
Reservations.class
etc…
Then remove all these static methods and use the Lazy Loading class to retain his instance.
registry.addLazy(LastCities.class, new LazyServiceRegistry.LazySetter<LastCities>() {
    @Override
    public LastCities get() {
        return new LastCities(appContext);
    }
});
To finish, we will access this object using the Async method of the Lazy Loading class. Once we get the object, we will update the UI directly there.
DineApp.getRegistry().get(LastCities.class, new LazyServiceRegistry.Callback<LastCities>() {
  @Override
  public void onInstanceReceived(LastCities instance) {
    // update UI
  }
});
Yes, it’s a bit more code but once folded cmd + ‘-’ on Mac, using retrolambda or java8 on AndroidStudio2.2 it’s not that bad.
DineApp.getRegistry().get(LastCities.class, (instance) -> {
    // update UI
  });
This service initialization is created at startup (App.onCreate). Once needed it’s initialized in a background thread and updates the UI on the main Thread.
If we still need to fasten a bit more the process, we can still create a GSON custom type to avoid the costly reflection as the NYTimes open blog post.
UIUtils.initReservation
What’s going on
This method creates people’s default number, default reservation hours, default day available. It is used on the first Activity displayed.
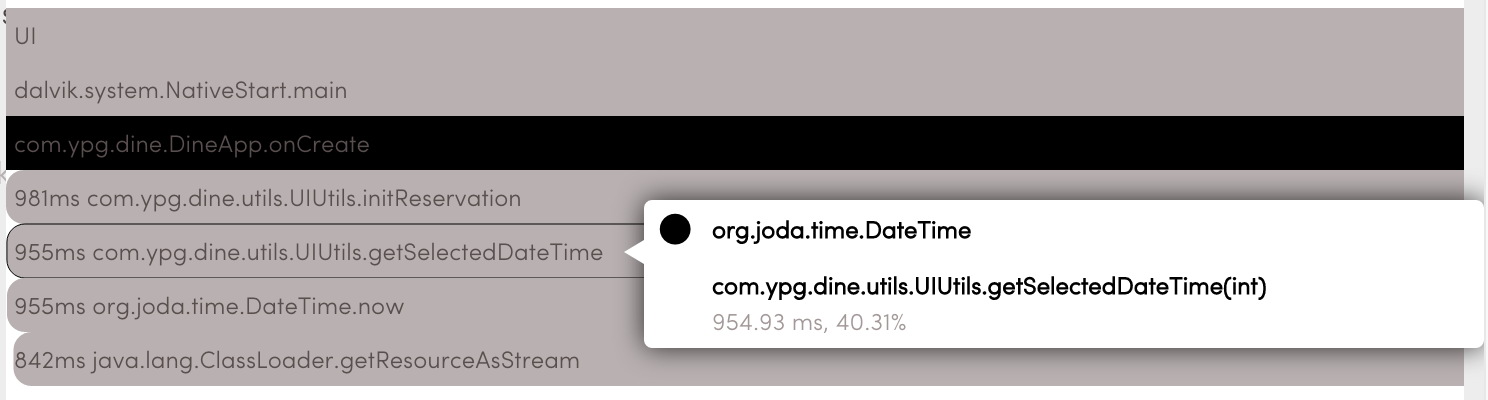
@NonNull
private static DateTime getSelectedDateTime(int days) {
    return DateTime.now().plusDays(days);
}
How to patch
Let’s take a look at this line, DateTime.now().plusDays(days). DateTime.now() is the culprit, even if we remove it, the next now() will be back and cause the same problem. JodaTime is clearly blocking the MainThread for around 800ms on his own. That’s a huge impact. We should take care of that kind of methods whose impact is not easy to find while we code.
What can we do to fix the first call to DateTime.now() latency?
At the end of the code, we can find those lines.
defaultItems[0] = partySizes.get(2);//2 peoples
defaultItems[1] = daysAvailable.get(1);// today
defaultItems[2] = timesAvailable.get(3);// some hour near now
Can’t we use default data displayed to the user while we load the logic to be displayed then?
When we are able to slightly modify tasks requirements we can save huge impacts on users (It’s not often possible though). By example here, Party Size can always be 2 and the day available today no need for any significant calculations on that. But how do we do for the time available?
JodaTime is a pretty big library, useful in some cases but we don’t have to rely on it for everything. I have done this “not” scientific test in Kotlin on a new App’s activity (runned the test 3 times with similar results on emulator. yep… for science…).
Log.d("APP", "StartTime Calendar")
var hour = Calendar.getInstance().get(Calendar.HOUR_OF_DAY) // takes 0 to 1ms on an emulator
Log.d("APP", "StopTime Calendar")

Log.d("APP", "StartTime Joda")
var hour2 = DateTime.now().hourOfDay // takes 57 to 68ms on an emulator
Log.d("APP", "StopTime Joda")
Do we really need to use JodaTime to get the hour of the day? So switching for a more basic calendar can greatly reduce the latency.
All the massive calculations can be started on a background thread to be ready when the user will click on the button. We don’t need it right now.
Conclusion
We have seen how to profile our startup time and extract the biggest problems. We had our hands on some code and modified it to get a better user experience by increasing performance. To conclude, we found that using a big library is not often the best tool performance wise, and to always think about our code impact on our user.
As a side note, we should always keep track of the cold start, it’s a good indicator about what is going on in the code, if we are correctly using libraries, and don’t impact too much the application cold start.
Check out our apps:
YP Dine is an application of the play store built by Yellow Pages Canada. His goal is to let you discover restaurants, browse through handmade lists from local food experts or book a table directly from the app. Between the time I started this post and now, a month passed, and a lot of the code base has changed.
YP Search let you find great local store with all their characteristics from opening hours to addresses, phone numbers.
Here we are, so help your user have a great experience and have an excellent profiling day.
Credits: Snow Flake photo comes from Alexey Kljatov, all rights reserved to the creator.